Blog:
Sara Shipley Hiles on Enriched Narrative with Geo-Mapping
A conversation about geo-mapping with Sarah Shipley Hiles by JA’s Caitlin Giddings

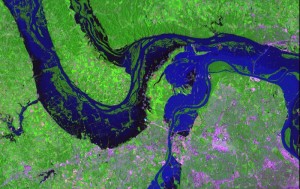
Flood waters of the Illinois, Mississippi, and Missouri Rivers near St. Louis, Missouri on July 29, 1993 (Gumley and King, 1993)
Programs like MODIS and GIS might be changing how journalists report stories now, but using mapping programs to source and illustrate articles is nothing new.
In 2003, before many geoinformation programs were available online to journalists, Sara Shipley Hiles conducted an influential project on flood plain development, published in the St. Louis Post-Dispatch as a “Flood of Development: 10 Years Later.”
The story used satellite images from before and after the St. Louis flood of 1993 to compare how formerly flooded land was already being redeveloped without regard to the risk of another disaster.
But initially, Hiles started with one question: From a financial and environmental standpoint, why would developers put buildings on land that had already flooded?
“That question led to an investigation of flood plain development and how that’s regulated,” Hiles explains. “But the key thing we needed to know is: How much of the plain actually had been developed? Without looking at satellite imagery there was really no way to assess that. Getting on the ground you could see the buildings and developments that were there, but you couldn’t compare data from 10 years ago to today without actually getting a hold of satellite images from 10 years prior and that time. So that’s what we ended up doing.”
The Post-Dispatch contracted the study out to a university because, at the time, satellite technology required more expertise to interpret and the images had to be purchased.
“It’s a little different today,” Hiles says. “The technology is better and, more information is publicly available. We made the decision to contract it out, and the editor at the time approved that, which I thought was fantastic because it was a $10,000 study. They were able to get satellite images from the flooding and stitch together multiple images to cover the duration of the flood and take new satellite images to show how much of that same landmass that was under water was now developed. They looked at all kinds of development, whether that was parking lots or buildings or whatever. They came up with a figure, and then on the ground we took a look at what businesses were there to come up with a financial figure. It worked well, and I don’t think we could have done the same story without using satellite imagery. It’s a unique tool—it gives you information that you otherwise wouldn’t have.”


Weigh In: Remember to refresh often to see latest comments!
0 comments so far.